AI spend at a Shopify merchant now has three parts: seats, tokens, and output. Most merchants we talk to track the first, sort of watch the second, and never measure the third. A simple internal dashboard fixes that. It answers three questions at all times: what are we spending on AI, who is using it internally, and what did it produce.

Video transcript
As a Shopify merchant, you should be able to answer three questions at all times. What are we spending on AI? Who is using it internally? And what did it produce? Here's the dashboard we build to answer them. Spend, usage, output. This simple dashboard lives on a company internal page that the owner and management keep pulled up and it updates in real time. Here is what is on it. Total AI spend, seats plus tokens against a monthly cap. Hours worked, the hours of work AI did for the team, email drafts unmodified, and errors caught.
Two of those deserve a closer look. Email drafts unmodified is the share of AI drafts sent as written. Shopify's own figure is about 50%. Errors caught counts the wrong prices, fitment data, or quantities a model caught before a customer was impacted. Then token spend by functional area and by model. You can see catalog and fitment, customer support, and B2B sales at the top. And which model is doing the work in each one.
How do you set it up? Route every workflow call through one gateway. Cloudflare logs tokens and cost per request and pairs with a model switching layer so you can swap models. Then log three events per email draft: drafted, checked, sent. Assign a reviewer model for every workflow. A frontier model like Opus 5.5 or Fable 5.1 checks the lower-cost models' work. With spend and output in one live view, you can see which AI workflows are the most productive relative to their cost. We build AI token dashboards for Shopify merchants and we can build the first workflow with your team. Reach out to Ambaum.
The three questions
Spend. Usage. Output. The dashboard lives on an internal page the owner and management keep pulled up, updated in real time. If you cannot answer all three today, this is the dashboard to build.
What is on the dashboard
Four numbers, one glance. Take the example dashboard from the video: a Shopify parts merchant, September 2026, month to date.
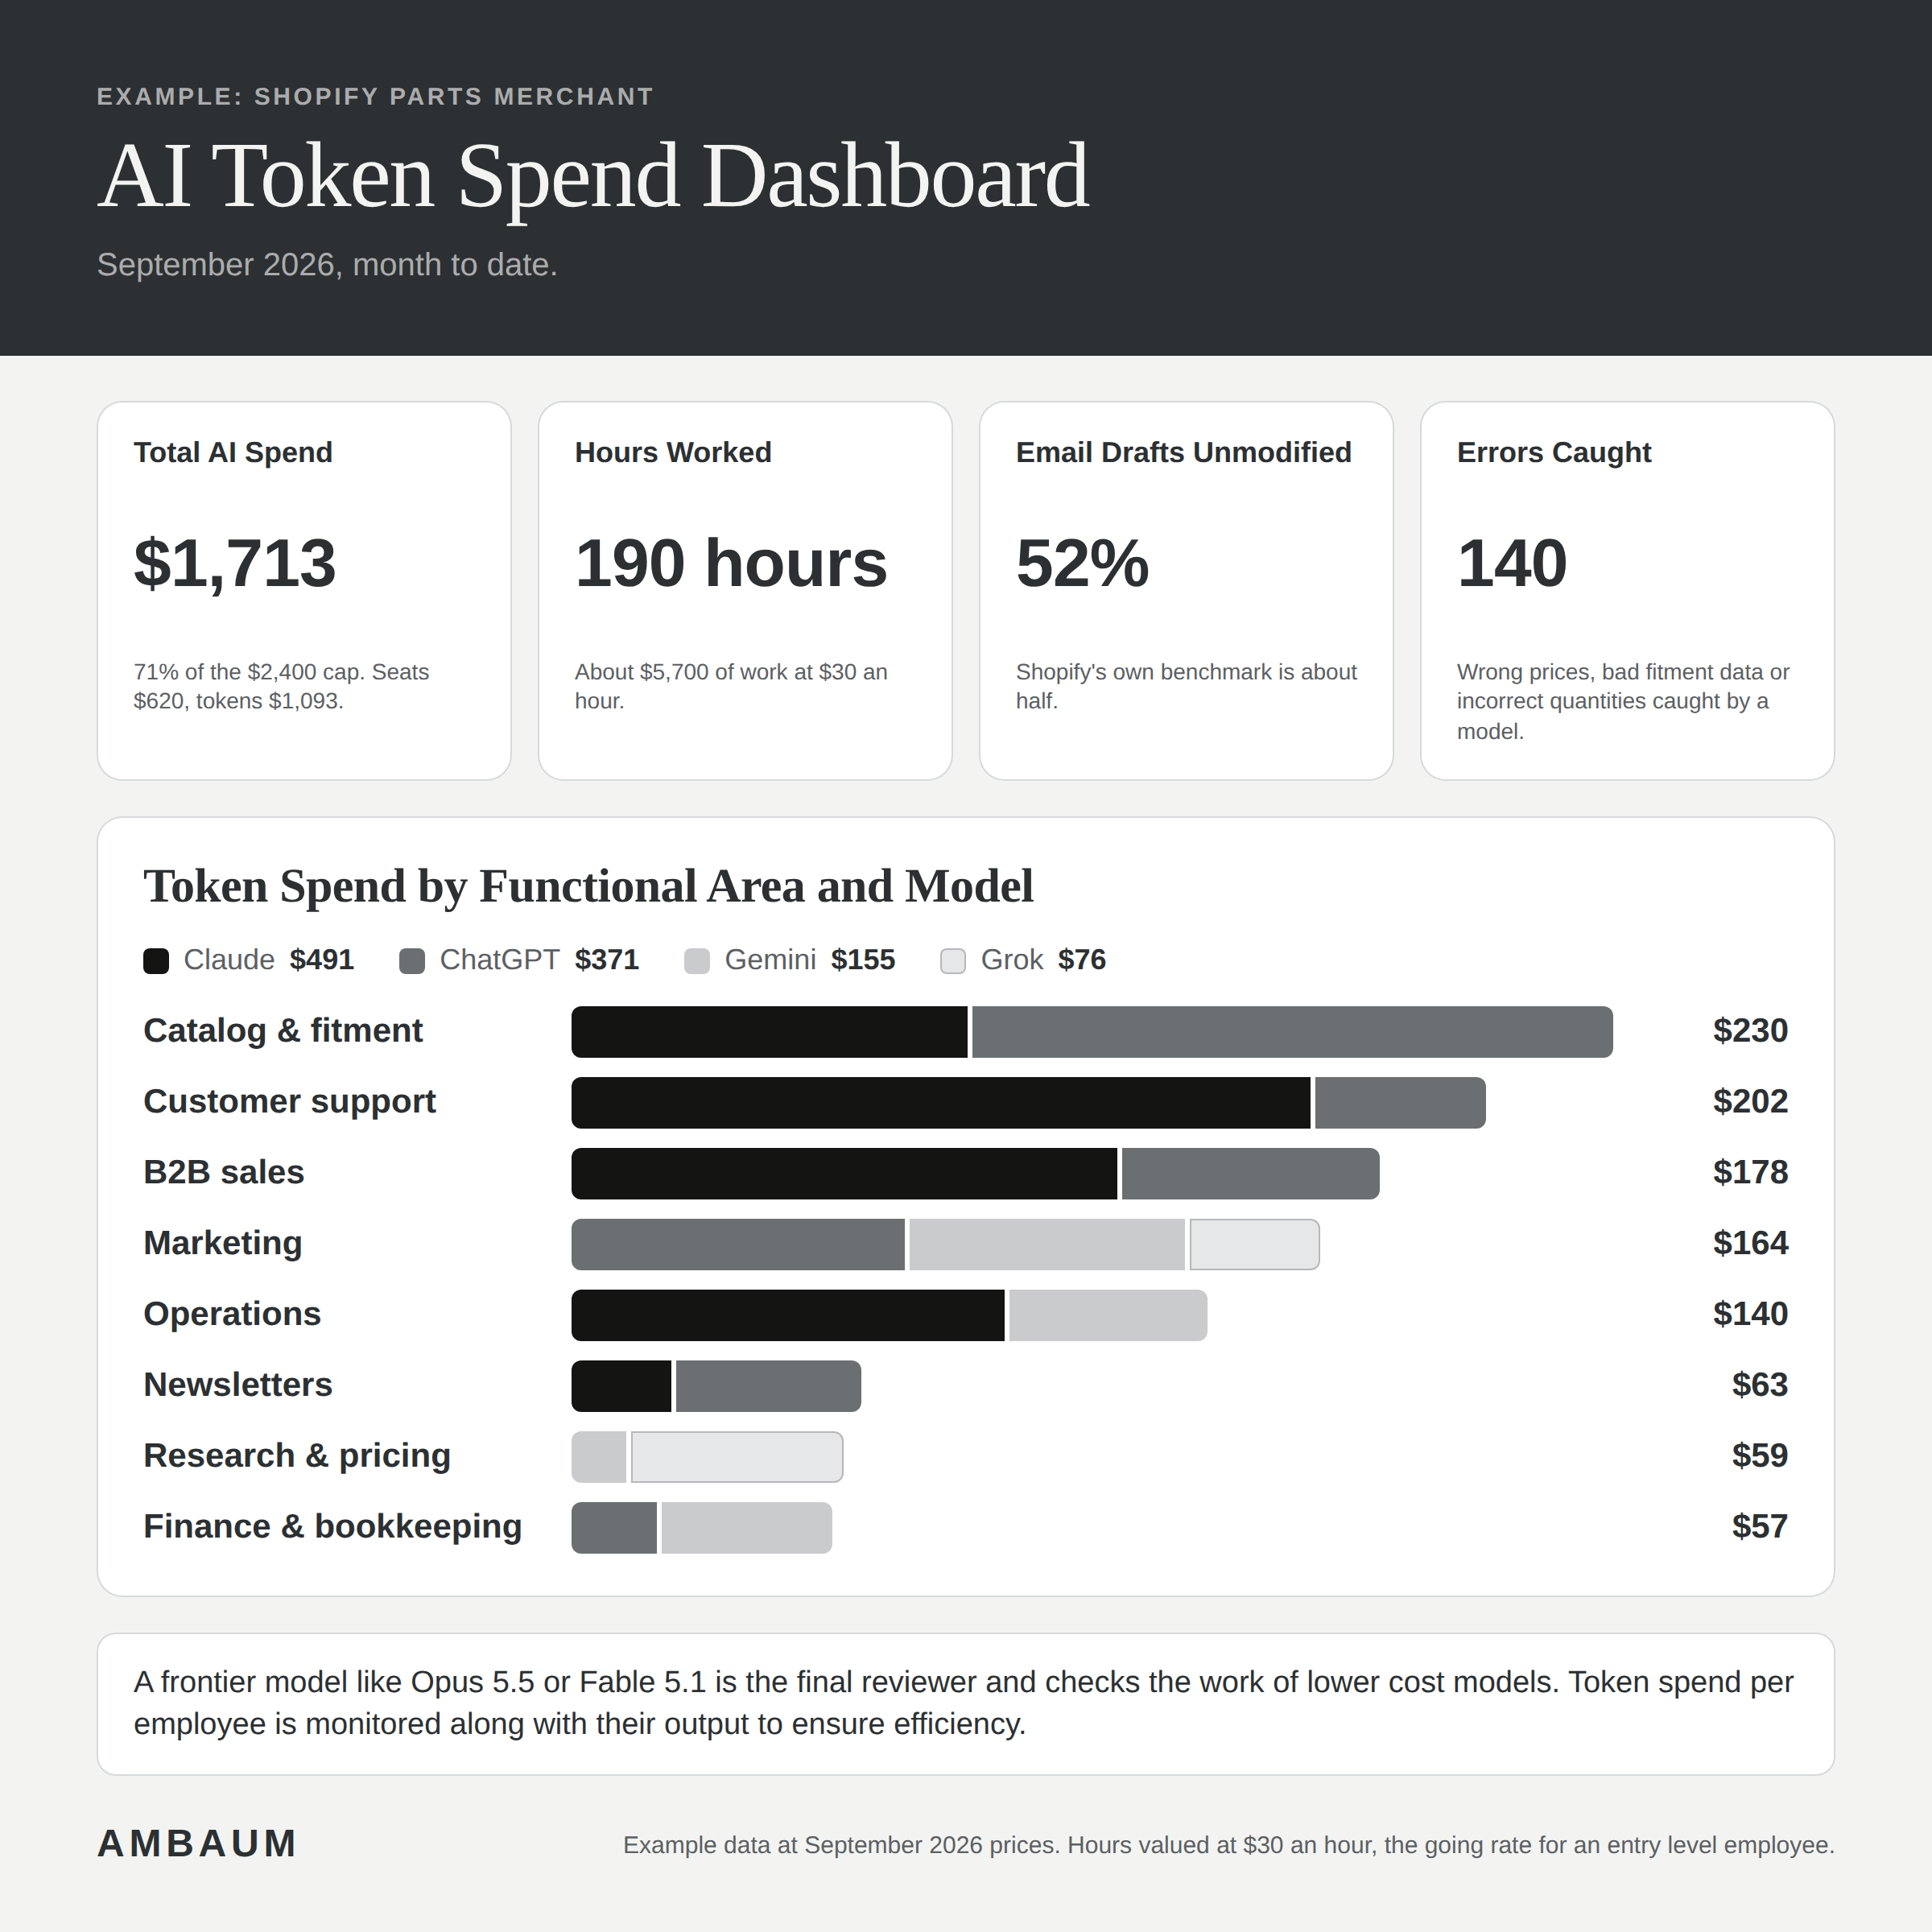
1. Total AI Spend. Seats plus tokens against a monthly cap. In the example: $1,713 against a $2,400 cap, with seats at $620 and tokens at $1,093. The cap is the point. Without one, token spend is a line item nobody owns.
2. Hours Worked. Hours of work the AI did for the team. In the example: 190 hours, roughly $5,700 of work at $30 an hour. This is the number that turns tokens into something a P&L understands.
3. Email Drafts Unmodified. The share of AI email drafts sent as written. In the example: 52%. This one deserves its own sentence, because there is no published industry benchmark we trust for it. It is your number to own. If it drops, your prompts are drifting and your team is quietly doing the model's job for it. If it climbs, the workflow is earning its keep.
4. Errors Caught. Wrong prices, fitment data, or quantities a model caught before a customer was impacted. In the example: 140. This is the quietest, most valuable number on the page.
Two of these deserve a closer look. Drafts unmodified and errors caught are where the output shows up. Output metrics turn a cost line into a productivity line.
Spend by area and model
Next question: which team is spending, and which model is doing the work. The example breaks token spend by functional area and model. Claude at $491, ChatGPT at $371, Gemini at $155, Grok at $76. Catalog and fitment leads at $230, then customer support at $202, B2B sales at $178, marketing at $164, operations at $140, with newsletters, research and pricing, and finance trailing.
The bars are the conversation starter: is that spend earning its keep? A merchant spending $230 a month on catalog and fitment tokens should know what that bought. If the fitment data feeding your agents is wrong, the tokens were wasted before the model ever ran. We covered that same catalog discipline in our agentic product rewrites piece, and the rule is identical here: garbage in, tokens out.
Anthropic made the same argument from the vendor side in July, when it shipped native spend dashboards, threshold alerts, and spend APIs for organizations running Claude at work. The industry is converging on one idea: token spend without visibility is just a bill.
How to set it up: three moves, in order
1. One gateway. Route every workflow call through it. Cloudflare's AI Gateway logs token usage and cost on every request, and lets you set custom costs for models outside its price book. OpenRouter's Model Fallbacks let you list models in priority order and fail over automatically when the primary is down, rate limited, or refuses. One gateway, every call, no exceptions. Otherwise your dashboard has holes.
2. Three events per email draft. Log drafted, checked, and sent for every email draft. That is how you catch errors and improve the process. The drafted-to-sent trail is also what feeds the drafts-unmodified number above, so this move and that metric are the same work.
3. A reviewer model. The cheap model does the work, the frontier model checks it. A frontier model like Claude Opus 5.5 or Fable 5.1 reviews the cheaper model's output and catches what it missed. For most merchants, Claude Sonnet 5.5 at $2 per million input tokens is the sane reviewer pick: same generation, half the Opus price. The reviewer's job is narrow. It does not write. It checks.
Once every call goes through the gateway, the dashboard fills itself in.
Why it matters
Spend and output in one live view tells you three things: which AI workflows are the most productive relative to their cost, where a frontier reviewer is catching real errors, and where to put the next AI workflow.
Token spend without output is just a bill. Together, it is a management tool.
Four things to check this week
- List every AI tool your team pays for, seats plus API keys. That is your spend baseline.
- Route one workflow's calls through a single gateway so tokens and cost are logged per request. Cloudflare AI Gateway or OpenRouter both do this today.
- Start logging drafted, checked, and sent on one email workflow. Two weeks of that trail is enough to see the pattern.
- Assign a reviewer model to that workflow and count what it catches. That count is your first output metric.
At Ambaum we build AI token dashboards for Shopify merchants, and we build the first workflow with your team. If you want a second set of eyes on what your AI is costing and producing, reach out.
No pitch. No pressure. Just perspective.
What is an AI token spend dashboard?
A live internal dashboard that answers three questions: what you are spending on AI (seats plus tokens against a cap), who is using it internally (by team, workflow, and model), and what it produced (hours worked, drafts sent as written, errors caught before a customer was impacted).
How do I track AI token spend per request?
Route every workflow call through one gateway. Cloudflare's AI Gateway logs token usage and cost on each request, with custom cost headers for models outside its price book, plus a dashboard and GraphQL analytics API. OpenRouter exposes per-request cost through its generation API.
What are OpenRouter Model Fallbacks?
The models parameter lets you list model IDs in priority order. If the primary model's providers are down, rate limited, or refuse the request, OpenRouter automatically tries the next model in the list. You are billed for whichever model ultimately served the request.
Which model should review my AI workflows?
A frontier model checking a cheaper model's work is the pattern that works. Claude Opus 5.5 and Fable 5.1 are current options; for most merchants Claude Sonnet 5.5 at $2 per million input tokens is the value pick for the reviewer slot.
What does "email drafts unmodified" tell me?
The share of AI email drafts your team sends as written. It is your own quality signal, not an industry benchmark. If it drops, your prompts are drifting and your team is doing the model's job for it.
Do I need the full dashboard on day one?
No. Start with one workflow, one gateway, and the drafted/checked/sent trail. The dashboard grows as more calls flow through the gateway.